



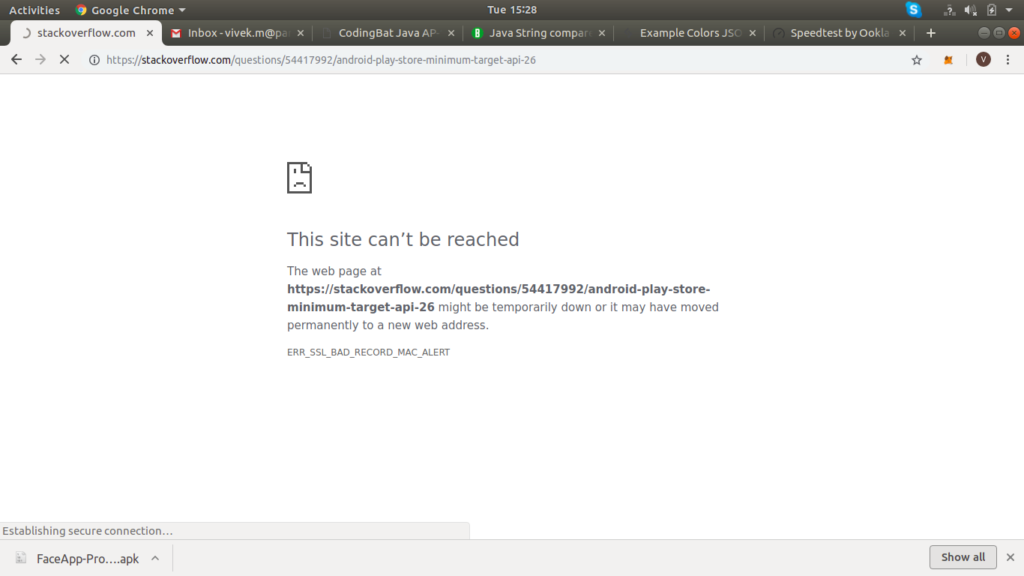
ERR_SSL_BAD_RECORD_MAC_ALERT is one of the less common Chrome SSL errors, and one of the most misread. It carries the letters “SSL”, so most troubleshooting guides treat it as a certificate problem. It is not one. By the time this error appears, the certificate has already been presented, checked, and accepted, and the connection is already encrypted.
This guide explains what the error actually is, which side of the connection produces it, and how to work through the causes that genuinely trigger it.
Quick answer:
ERR_SSL_BAD_RECORD_MAC_ALERT means the server sent your browser a fatal bad_record_mac alert because it received a TLS record it could not decrypt and verify. This happens after the handshake, under the symmetric session keys, so the website’s SSL certificate is not involved. The usual cause is data being corrupted or rewritten between your device and the server: a faulty network adapter or driver, buggy segmentation or checksum offload, an MTU problem, or software that intercepts HTTPS traffic. Start by testing the same site on a different network.
The alert itself is all the detail you get. RFC 8446 section 6.2 specifies bad_record_mac for every deprotection failure, both because AEAD ciphers merge decryption and verification into a single step and to avoid side-channel attacks, so it confirms that a record failed but never says why. Related faults stay separate, since an oversized record returns record_overflow and a bad signature, Finished message, or PSK binder returns decrypt_error, which is why the steps below narrow the cause by elimination.
What Is ERR_SSL_BAD_RECORD_MAC_ALERT?
To understand this error, it helps to separate a TLS connection into its two stages. The first is the SSL/TLS handshake, where the browser and the server agree on a protocol version and a cipher suite, the server proves its identity with its SSL certificate, and the two sides derive a shared set of symmetric session keys. The second stage is the record layer, where every byte of the actual page, image, and form submission travels inside encrypted TLS records protected by those session keys.
ERR_SSL_BAD_RECORD_MAC_ALERT belongs entirely to the second stage. Modern cipher suites use AEAD encryption, which combines decryption and integrity verification into a single operation: the receiver either gets back the original plaintext, or it gets an error. There is no separate integrity check to fail on its own. When that operation fails, the TLS specification does not allow the connection to continue. RFC 8446 requires the receiver to terminate the connection with a fatal bad_record_mac alert, which is alert number 20.
RFC 8446 section 6.2 is specific about what this alert means and how often it should be seen. It is returned when a record is received that cannot be deprotected, it covers all deprotection failures, and it should never appear between correctly written implementations “except when messages were corrupted in the network”. RFC 5246, which defines TLS 1.2, says the same thing and adds that the alert is always fatal.
That single sentence is the most useful diagnostic in this whole guide. The specification itself points at the network path, not at the certificate. Something between the two endpoints changed the bytes after they were encrypted, or one of the two endpoints produced or read them incorrectly.
Which Side Sends the Alert?
This is where most write-ups get the error backwards. The direction is defined in Chromium’s own error list, where the error is declared as NET_ERROR(SSL_BAD_RECORD_MAC_ALERT, -126) with the comment “An SSL peer sent us a fatal bad_record_mac alert.” The same source notes that the condition “has been observed from servers with buggy DEFLATE support”.
The _ALERT suffix is used consistently in that list to mean an alert received from the peer rather than one the browser generated. Its neighbors follow the identical pattern: SSL_DECOMPRESSION_FAILURE_ALERT, SSL_DECRYPT_ERROR_ALERT, and SSL_UNRECOGNIZED_NAME_ALERT are all described as alerts the peer sent to the browser.
So the sequence behind the error page is the reverse of what it looks like:
- Your browser and the server complete a successful handshake and agree on session keys.
- Your browser encrypts a record and sends it.
- The record arrives at the server altered, truncated, reordered, or rewritten.
- The server cannot verify it, so it sends back a fatal bad_record_mac alert and drops the connection.
- Chrome reports the alert it received as ERR_SSL_BAD_RECORD_MAC_ALERT.
The practical consequence is that the corruption most often affects data leaving your machine. That is why the fixes below concentrate on your network adapter, its offload settings, your MTU, and anything that sits in the path and rewrites traffic.
Does This Error Mean Your Data Was Exposed?
No, and the opposite is closer to the truth. It is easy to read a security alert as a security breach, but a fatal bad_record_mac is the integrity check doing exactly what it was designed to do.
The AEAD verification failed, which means the record was rejected instead of being processed. Its contents were never handed to the application, and the connection was torn down rather than allowed to continue on data that could not be trusted. An attacker who tampers with a record in transit cannot make that record verify, because they do not have the session keys. All they can do is cause this error.
In other words, the broken page is the protection working, not the protection failing. In the overwhelming majority of real cases the cause is not an attack at all, it is faulty hardware or a device in the path mangling packets.
Save 10% on SSL Certificates when ordering from SSL Dragon today!
Fast issuance, strong encryption, 99.99% browser trust, dedicated support, and 25-day money-back guarantee. Coupon code: SAVE10

What Are the Causes of the ERR_SSL_BAD_RECORD_MAC_ALERT Error?
Every genuine cause falls into one of two groups: something corrupts the encrypted bytes in transit, or a third party terminates and re-encrypts the connection and does it badly. A third, rarer group covers faults inside one of the two endpoints themselves.
Packet Corruption on the Network Path
This is the cause the TLS specification names directly. Unstable links, failing cabling, marginal Wi-Fi, a dying switch port, or overheating hardware can all flip bits in transit. TCP checksums catch a lot of this, but they are a weak 16-bit check and corruption does get through, particularly when the damage happens inside a device that recalculates the checksum afterwards.
Once a TLS record is altered, nothing downstream can repair it. The AEAD verification fails and the connection ends.
A Faulty Network Adapter, Driver, or Firmware
Network adapters move data between your device and the network, and a hardware fault, an unstable driver, or outdated firmware can corrupt data on the way out. This is one of the most frequently confirmed causes of the error, and it explains why the problem often follows a specific machine rather than a specific website.
A useful signature: the error appears on large transfers and sustained downloads while small requests succeed. Corruption is a probability game, so a bigger transfer means more records and a much higher chance of hitting a bad one.
Segmentation and Checksum Offload Bugs
This is a distinct cause from a generally faulty adapter, and it is missing from most guides. Modern network cards take work off the CPU: TCP segmentation offload lets the card split a large buffer into packets itself, and checksum offload lets it calculate the TCP and IP checksums in hardware.
The important detail is the ordering. TLS encrypts the data first, then hands it to the TCP stack, which hands it to the card. If a buggy offload engine mis-splits a buffer or writes the wrong bytes, it damages data that is already encrypted, and then calculates a perfectly valid checksum over the damaged result. The corruption passes every lower-layer check and only surfaces when the server tries to verify the TLS record.
Cases of this have been reported on common onboard chipsets, where sustained HTTPS transfers fail with bad record MAC errors while the adapter’s own error counters stay clean. Turning the offload features off is the standard way to confirm it.
MTU Size, Fragmentation, and PMTUD Black Holes
The Maximum Transmission Unit is the largest packet an interface will send in one piece. Standard Ethernet uses 1500 bytes, and connections that add encapsulation, such as PPPoE or a VPN tunnel, need less than that because the extra headers eat into the same budget.
Trouble starts when your device sends packets larger than some link along the path can carry. Path MTU Discovery is supposed to handle this: the oversized packet is dropped and an ICMP “fragmentation needed” message tells the sender to use a smaller size. When a firewall along the way blocks those ICMP messages, the sender never learns, keeps sending packets that are silently discarded, and you get a PMTUD black hole. Large TLS records are the first casualty, because they are the packets most likely to exceed the limit.
Note the direction of the fix, because a lot of advice on this error gets it the wrong way round: lowering the MTU is the workaround, not raising it.
Antivirus or Firewall HTTPS Inspection
Many security products include an HTTPS inspection feature, sometimes called SSL scanning or web shield. It is worth being precise about how it works, because the mechanism is what matters here.
The product does not passively watch your encrypted traffic, since it could not read it if it did. Instead it installs its own root certificate on your machine and inserts itself into the middle of every HTTPS connection. It terminates the TLS session from your browser, decrypts the traffic, inspects it, then opens a second TLS session to the real server and re-encrypts everything. Your browser is talking to the antivirus, and the antivirus is talking to the website.
That means there are now two record layers instead of one, and a bug on either side produces records that fail verification. These products are meant to protect you from harmful websites, but their TLS implementations are frequently weaker than the browser’s, which is why HTTPS interception has been the subject of formal security advisories.
A TLS-Inspecting Middlebox, Corporate Proxy, or Carrier Proxy
The same interception mechanism runs on network hardware as well as on your device. Corporate firewalls, secure web gateways, school and hotel networks, and some mobile carriers run transparent proxies that decrypt and re-encrypt HTTPS traffic without any configuration on your machine.
When one of these devices is overloaded, running old firmware, or handling an unusual cipher suite or TLS extension badly, it emits records the far end cannot verify. The giveaway is that the error follows a network rather than a device: the same laptop works fine at home and fails on the office or hotel connection.
VPNs and Tunnels
A VPN wraps your traffic in another layer of encryption and headers. That has two effects that both lead here. It reduces the space available for your data inside each packet, which makes MTU problems considerably more likely, and it adds another software stack that can mishandle packets under load or when the tunnel reconnects.
If the error started when you connected to a VPN, or stops when you disconnect, the tunnel is the place to look first.
Failing Memory or a Faulty CPU
This one is rare, but it is real and worth knowing about because it is invisible to every network-level test. Encryption is unusually sensitive to hardware faults: a single flipped bit in RAM, or a defective vector instruction unit in the CPU, changes the ciphertext or the authentication tag and guarantees a verification failure at the other end.
Documented cases exist where persistent bad record MAC errors, alongside failing package-signature checks and corrupted downloads, were eventually traced to a defective processor and resolved by replacing it. In one such case reported on the Arch Linux forums, cryptographic algorithms failed repeatably under stress testing, the fault was isolated to the CPU’s vector instruction units, and the manufacturer replaced the chip under warranty. Suspect hardware when the error appears across many different websites, on several networks, and survives every network-level fix below.
A Buggy TLS Stack on the Server or a Middlebox
Finally, the error is not always yours to fix. Chromium’s error list names a server-side case directly: the condition has been observed from servers with faulty DEFLATE compression support. That particular note is a historical one, since browsers no longer negotiate TLS compression, but the wider point stands. Older load balancers, TLS-terminating appliances, and unpatched server software can all produce or reject records incorrectly.
If the error appears on one specific website across several of your devices and networks, while every other HTTPS site works normally, the problem is at the other end.
How To Fix the ERR_SSL_BAD_RECORD_MAC_ALERT Error?
Before changing any settings, spend two minutes narrowing down where the fault is. It saves a lot of wasted effort, and it tells you whether there is anything for you to fix at all.
- Open the same site on a different device on the same network. If it fails there too, the problem is the network or the site, not your computer.
- Open it on the same device on a different network, such as a phone hotspot. If it works, the problem is the original network.
- Try several other HTTPS sites. If only one site fails everywhere, the fault is at that site’s end and none of the steps below will help.
Work through the steps below in order. They run from the quickest to the most involved, and each one targets a specific cause from the list above.
1. Switch Between Wi-Fi and Ethernet
The fastest test available. Switching between Wi-Fi and Ethernet puts your traffic through an entirely different adapter, driver, and physical path, which separates a hardware or driver fault from a problem further upstream.
If you are on Wi-Fi, plug in a cable and disable the wireless adapter so traffic cannot fall back to it. If you are already on Ethernet, do the reverse. Restart the browser and load the site again.
A result either way is useful. If one adapter works and the other does not, you have found the faulty component. If both fail identically, the adapter is not the problem and you can move on.
2. Update or Disable the Network Adapter Driver
If switching adapters pointed at one of them, update its driver. Download the current driver from the adapter manufacturer’s website rather than relying on Windows Update, which often keeps an older version. On Windows, open Device Manager, expand Network adapters, right-click the adapter, and choose Update driver.
If a recent driver update is what started the problem, use Roll Back Driver on the same properties page instead. Disabling the adapter entirely, while a second adapter carries the traffic, confirms whether that specific device is responsible.
3. Turn Off Segmentation and Checksum Offload
This targets the offload bug described earlier, and it is the step most guides never mention. Disabling offload moves the work back to the CPU. Throughput drops slightly, so treat it as a diagnostic first: if the error stops, you have identified the cause and can decide whether to leave the setting off or pursue a firmware update.
On Linux, check which offload features are currently enabled with the ethtool utility, replacing eth0 with your interface name:
ethtool -k eth0Turn off the segmentation offloads:
sudo ethtool -K eth0 tso off gso off gro offIf the error continues, turn off checksum offload as well:
sudo ethtool -K eth0 rx off tx offThese changes do not survive a reboot, which is what you want while testing. On Windows, the same settings live in Device Manager: open the adapter’s properties, go to the Advanced tab, and set entries such as Large Send Offload, TCP Checksum Offload, and IPv4 Checksum Offload to Disabled. Names vary between manufacturers.
4. Lower the MTU
If the error hits large pages, downloads, or uploads while small pages load fine, an MTU problem is likely. The fix is to lower the MTU so your packets fit through the smallest link on the path. Do not raise it: a larger MTU makes the problem worse.
First find the largest size that actually gets through, using ping with the do-not-fragment flag. The payload sizes below exclude 28 bytes of IP and ICMP headers, so a successful 1472-byte payload means a working MTU of 1500.
On Windows:
ping -f -l 1472 example.comOn Linux:
ping -M do -s 1472 -c 4 example.comOn macOS:
ping -D -s 1472 -c 4 example.comIf the reply says the packet needs to be fragmented, lower the size and try again until it succeeds. You may instead get no reply at all, just silence and packet loss, which is the black-hole case described above and means the same thing: the packet is too big for the path. Add 28 to the largest payload that works, and that is your usable MTU. A payload of 1372, for example, means an MTU of 1400.
On Windows, check the current values with:
netsh interface ipv4 show subinterfacesThen set the new value, using the interface name exactly as it appears in that output:
netsh interface ipv4 set subinterface "Ethernet" mtu=1400 store=persistentYou can also set the MTU on the router so it applies to every device on the network. This is done on your router’s own admin page, not through your internet provider. Type your router’s address into a browser, usually 192.168.1.1 or 192.168.0.1, sign in, open the WAN settings, and change the MTU value there. The address and credentials are normally printed on a label on the router itself.
1400 is a safe starting value that clears most encapsulation overhead. If it resolves the error, you can raise it in small steps to recover throughput.
5. Turn Off HTTPS Inspection in Your Antivirus or Firewall
Disable the HTTPS inspection feature specifically rather than switching off your antivirus altogether. It is the component that touches TLS, and turning off only that feature keeps the rest of your protection running while you test.
The setting hides under a different name in each product. Look for HTTPS scanning, SSL scanning, Encrypted connections scanning, Web shield, or Secure connections, usually inside the web or network protection section. Turn it off, restart the browser, and reload the site.
If that fixes it, check for an update to the security product before leaving inspection disabled permanently, since these bugs are usually fixed in later versions. Many products also allow specific sites to be excluded from inspection, which is a better compromise than turning the feature off entirely. Re-enable anything you disabled once you finish testing.
6. Bypass a VPN, Proxy, or Inspecting Middlebox
If you are on a VPN, disconnect it and reload the site. If that fixes the error, reconnect and lower the MTU inside the VPN client’s own settings, since tunnel overhead is a common trigger. Switching the VPN’s transport protocol, for instance from UDP to TCP, is also worth trying.
On a managed corporate or campus network, check the browser and system proxy settings, then test the same site on a phone hotspot. If the site works on the hotspot and fails on the managed network, an inspecting middlebox is the likely cause and only the network administrator can fix it. Give them the exact error name and the affected hostname, since it usually points at one appliance handling one type of connection badly.
7. Turn Off Intel Killer Traffic Prioritization
Devices with Killer network hardware run software that reorders and prioritizes traffic between applications, and that traffic shaping has a track record of interfering with connections in ways that produce this error.
The naming has changed, which makes older instructions hard to follow. Intel acquired Rivet Networks, the original maker of Killer products, in 2020. The software then went from Killer Control Center to Killer Intelligence Center, and was renamed again to the Intel Killer Performance Suite in 2023, though Intel still calls its interface component the Killer Control Center. Depending on your machine’s age you may find any of those names installed.
Open the application, find the traffic prioritization features, which appear as a prioritization engine or under a name such as Advanced Stream Detect, and turn them off. Restart the browser and try the site again. If the error persists, uninstalling the suite while keeping the plain network driver is the cleaner test, because it removes the shaping service entirely.
8. Rule Out Failing Memory or a Faulty CPU
Save this for when everything above has failed and the error shows up on many sites and more than one network. Look for corroborating symptoms, because a hardware fault rarely affects only your browser: failed software update signature checks, archives that will not extract, corrupted downloads, or unexplained application crashes all point the same way.
Test the memory first, with Windows Memory Diagnostic or a bootable Memtest86+ run over several passes. If memory is clean, a CPU fault is possible, since encryption leans heavily on vector instructions and a defective unit will corrupt ciphertext deterministically while the rest of the system looks fine. On Linux, a cryptographic stress test is the practical way to check it:
stress-ng --verify --seq 1 --with af-algWith no timeout set, stress-ng runs for 24 hours by default, so add --timeout 10m unless you want a long soak test. Repeatable failures in the cryptographic algorithms are strong evidence of a hardware fault and grounds for a warranty claim.
What If the Error Is Not on Your Side?
Some guides claim this error is always fixable from your end. That is not accurate. If the error affects one website across several devices and networks, stop changing settings on your machine. There is nothing there to fix.
If it is your own site, work through the server side of the connection instead:
- Update the TLS library and web server software. Record-layer bugs are fixed in patch releases and rarely get announced loudly.
- Check anything that terminates TLS in front of the application: load balancers, reverse proxies, WAFs, and TLS-offloading appliances are all candidates, and firmware on hardware appliances is often years behind.
- Disable TLS record compression if a legacy component still enables it. Chromium’s note about faulty DEFLATE support predates the removal of compression from browsers: Chrome has offered only null compression since the CRIME attack, so treat this as a legacy-stack check rather than a fix for a current browser connection.
- Apply the same offload and MTU checks to the server’s network interfaces. A server NIC can corrupt outbound records exactly as a desktop one can.
- Review the server error logs for the period when the failures occurred, which is the quickest way to see whether the server is sending the alert or receiving it.
Frequently Asked Questions
No. The certificate is presented and validated during the handshake, and this error happens after the handshake has already succeeded. At that point the connection is running on symmetric session keys and the certificate plays no further part. Renewing, reinstalling, or replacing a certificate will not affect this error. Certificate problems produce different messages, such as NET::ERR_CERT_DATE_INVALID.
No. The fatal alert means a record failed its integrity check and was rejected rather than processed, and the connection was closed instead of continuing on untrusted data. That is the protection working as designed. An attacker without the session keys cannot alter a record and still have it verify, so tampering can only cause this error, never a silent leak.
Your browser receives it. Chromium describes the error as an alert an SSL peer sent to the browser, which for a website means the server. The server could not verify a record your browser sent, so it terminated the connection. That is why the fixes concentrate on the outbound path from your device.
Lower it. Raising the MTU increases the chance that a packet is too large for some link on the path, which is the original problem. Lowering it to around 1400 leaves room for tunnel and encapsulation overhead. Confirm the right value by probing with ping and the do-not-fragment flag before changing anything permanently.
Because corruption is probabilistic. A small page fits into a handful of TLS records, while a large transfer sends many thousands, and only one needs to arrive damaged for the connection to be torn down. This pattern points strongly at MTU problems or a faulty offload engine on the network card rather than at anything to do with the website.
Almost never, despite how often that advice is repeated. Cached files and browser versions have no bearing on whether an encrypted record verifies. An outdated browser causes a version or cipher negotiation failure, reported as ERR_SSL_VERSION_OR_CIPHER_MISMATCH, which is a different failure at a different stage of the connection.
No. Nothing in TLS record protection takes time as an input, so an incorrect clock cannot make a record fail verification. Clock problems break certificate validity checks instead and produce NET::ERR_CERT_DATE_INVALID. Correcting your system time is good practice, but it will not resolve this particular error.
For more SSL error troubleshooting, check our detailed tutorials about fixing different SSL errors.
Save 10% on SSL Certificates when ordering from SSL Dragon today!
Fast issuance, strong encryption, 99.99% browser trust, dedicated support, and 25-day money-back guarantee. Coupon code: SAVE10

